HPMX-2003-T10 データシートの表示(PDF) - HP => Agilent Technologies
部品番号
コンポーネント説明
一致するリスト
HPMX-2003-T10 Datasheet PDF : 16 Pages
| |||
HPMX-2003 Typical Data
Measurement
Direct measurement of the ampli-
tude and phase error at the output
is an accurate way to evaluate
modulator performance. By mea-
suring the error directly, all the
harmonics, LO leakage, etc. that
show up in the output signal are
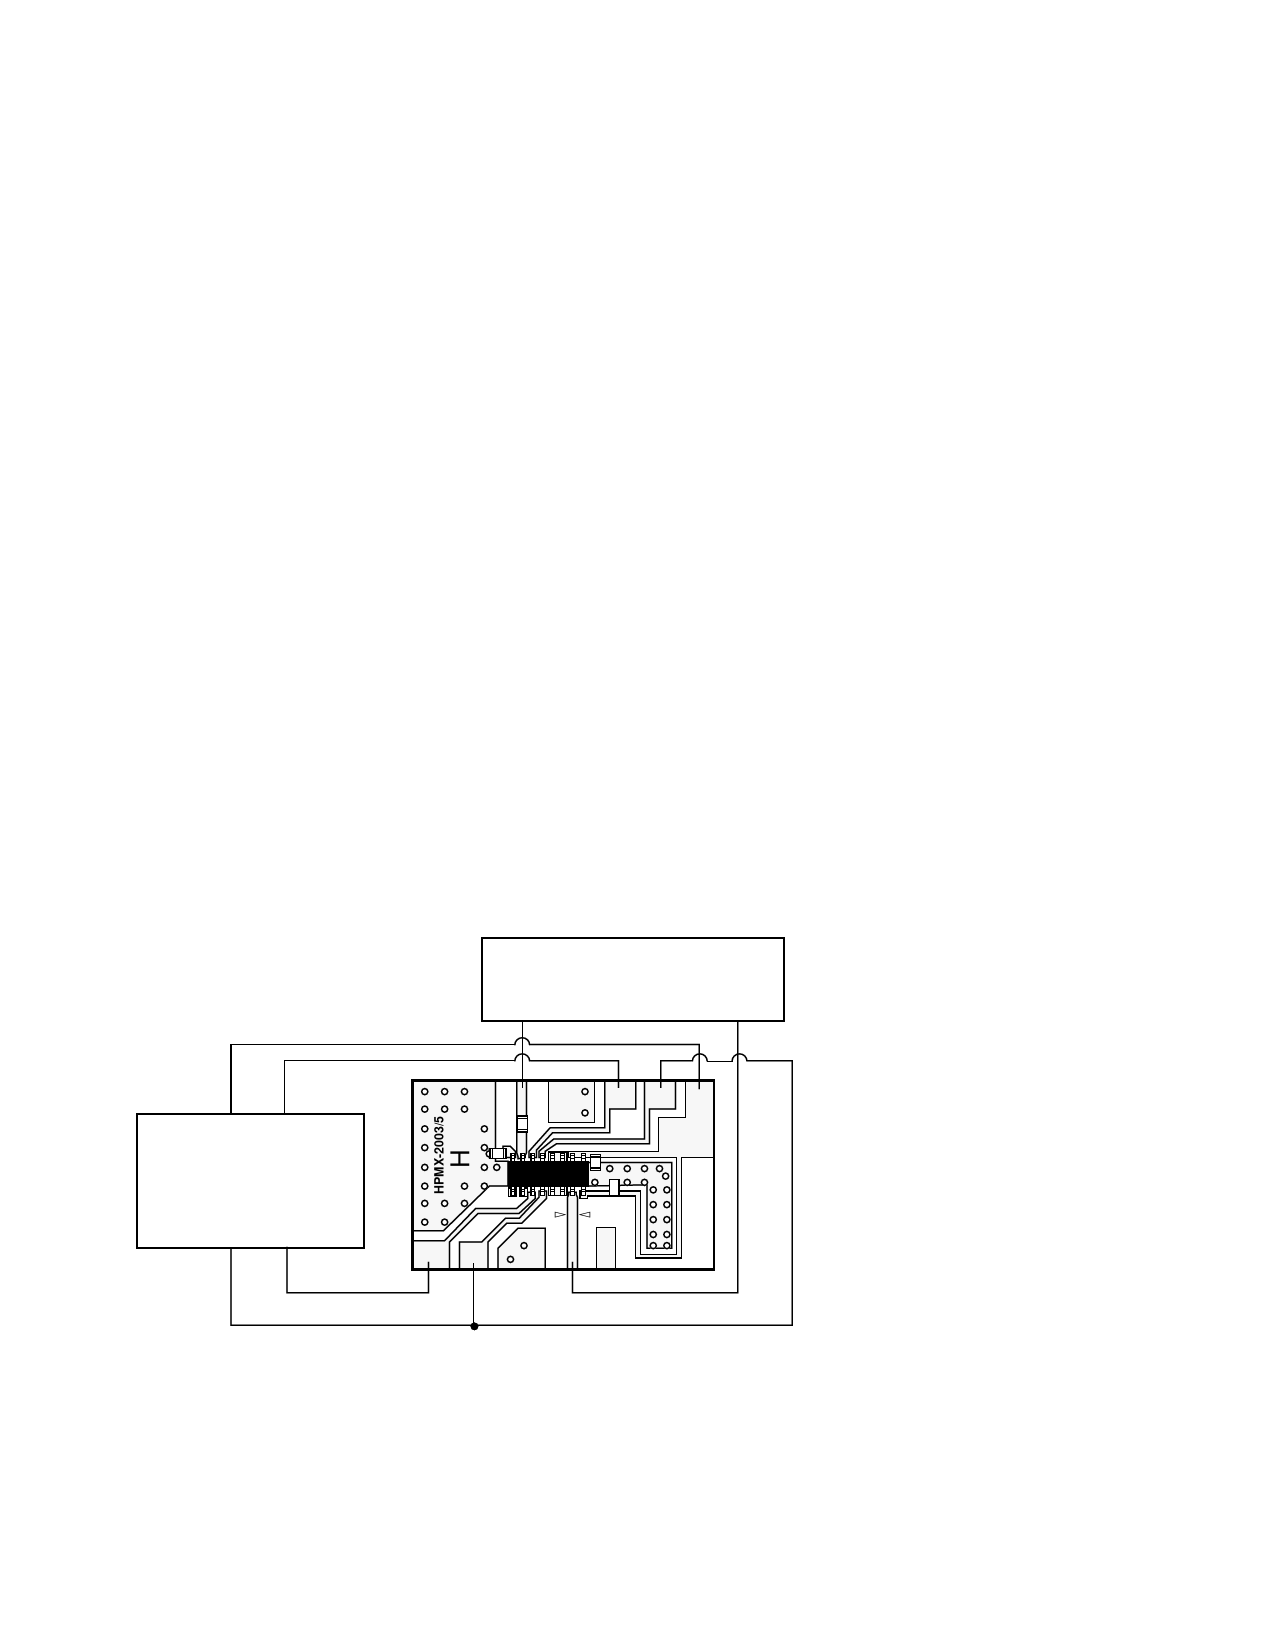
accounted for. Figure 3, below,
shows the test setup that was used
to create the amplitude and phase
error plots (figures 12 and 13).
Amplitude and phase error are
measured by using the four chan-
nel power supply to simulate I and
Q input signals. Real 2.5 Vp-p I and
Q signals would swing 1.25 volts
above and below an average 2.5 V
level, therefore, a “high” level in-
put is simulated by applying
3.75␣ V, and a “low” level by apply-
ing 1.25 V to the I and/or Q inputs.
Amplitude and phase are
measured by setting the network
analyzer for an S21 measurement
at frequency of choice. Set the
port 1 stimulus level to the LO
level you intend to use in your cir-
cuit (-12 dBm for the data sheet).
A 6-10 dB attenuator can be
placed in the line to port 2 to pre-
vent network analyzer overload,
depending upon the network ana-
lyzer you are using.
By adjusting the VImod and VQmod
settings you can step around the
I, Q vector circle, reading mag-
nitude and phase at each point.
The relative values of phase and
amplitude at the various points
will indicate the accuracy of the
modulator. Note: you must use
very low ripple power supplies
for the reference, VImod, and VQmod
supplies. Ripple or noise of only a
few millivolts will appear as wob-
bling phase readings on the net-
work analyzer.
The same test setup shown below
is used to measure input and out-
put VSWR, reverse isolation, and
power vs. frequency. VImod and
VQmod are set to 3.75 V and the
appropriate frequency ranges are
swept. S11 provides input VSWR
data, S22 provides output VSWR
data. S21 provides power output
(add source power to S21 derived
gain).
LO leakage data shown in figures
18, and 19 is generated by setting
VImod = VQmod = VIref = VQref = 2.5 V
then performing an S21 sweep.
Since phase is not important for
these measurements, a scalar net-
work analyzer or a signal genera-
tor and spectrum analyzer could
be used.
5V
VQmod
HP-6626A
SYSTEM DC POWER SUPPLY
(FOUR OUTPUTS)
2.5 V
VImod
HP-8753C VECTOR NETWORK ANALYZER
PORT 1
PORT 2
VER 1
C
C
I
R
LO
Q
C
C
OUT
R
VCC
5V
Figure 3. Test Setup for Measuring Amplitude and Phase Error, Input and Output
VSWR, Power Output and LO Leakage of the Modulator.
7-41
Share Link: 