AD8346 データシートの表示(PDF) - Analog Devices
部品番号
コンポーネント説明
一致するリスト
AD8346 Datasheet PDF : 20 Pages
| |||
CDMA SETUP
For evaluating the AD8346 with CDMA waveforms, the setup
shown in Figure 35 was used. This is essentially the same setup
as that used for the single sideband characterization, except that
the AFG2020 was replaced with the AWG2021 for providing the
I and Q input signals, and the spectrum analyzer used to monitor
the output was changed to an FSEA30 Rohde & Schwarz analyzer
with vector demodulation capability. The I/Q input signals for
these measurements were IS95 baseband signals generated with
Tektronix I/Q SIM software and downloaded to the AWG2021.
AD8346
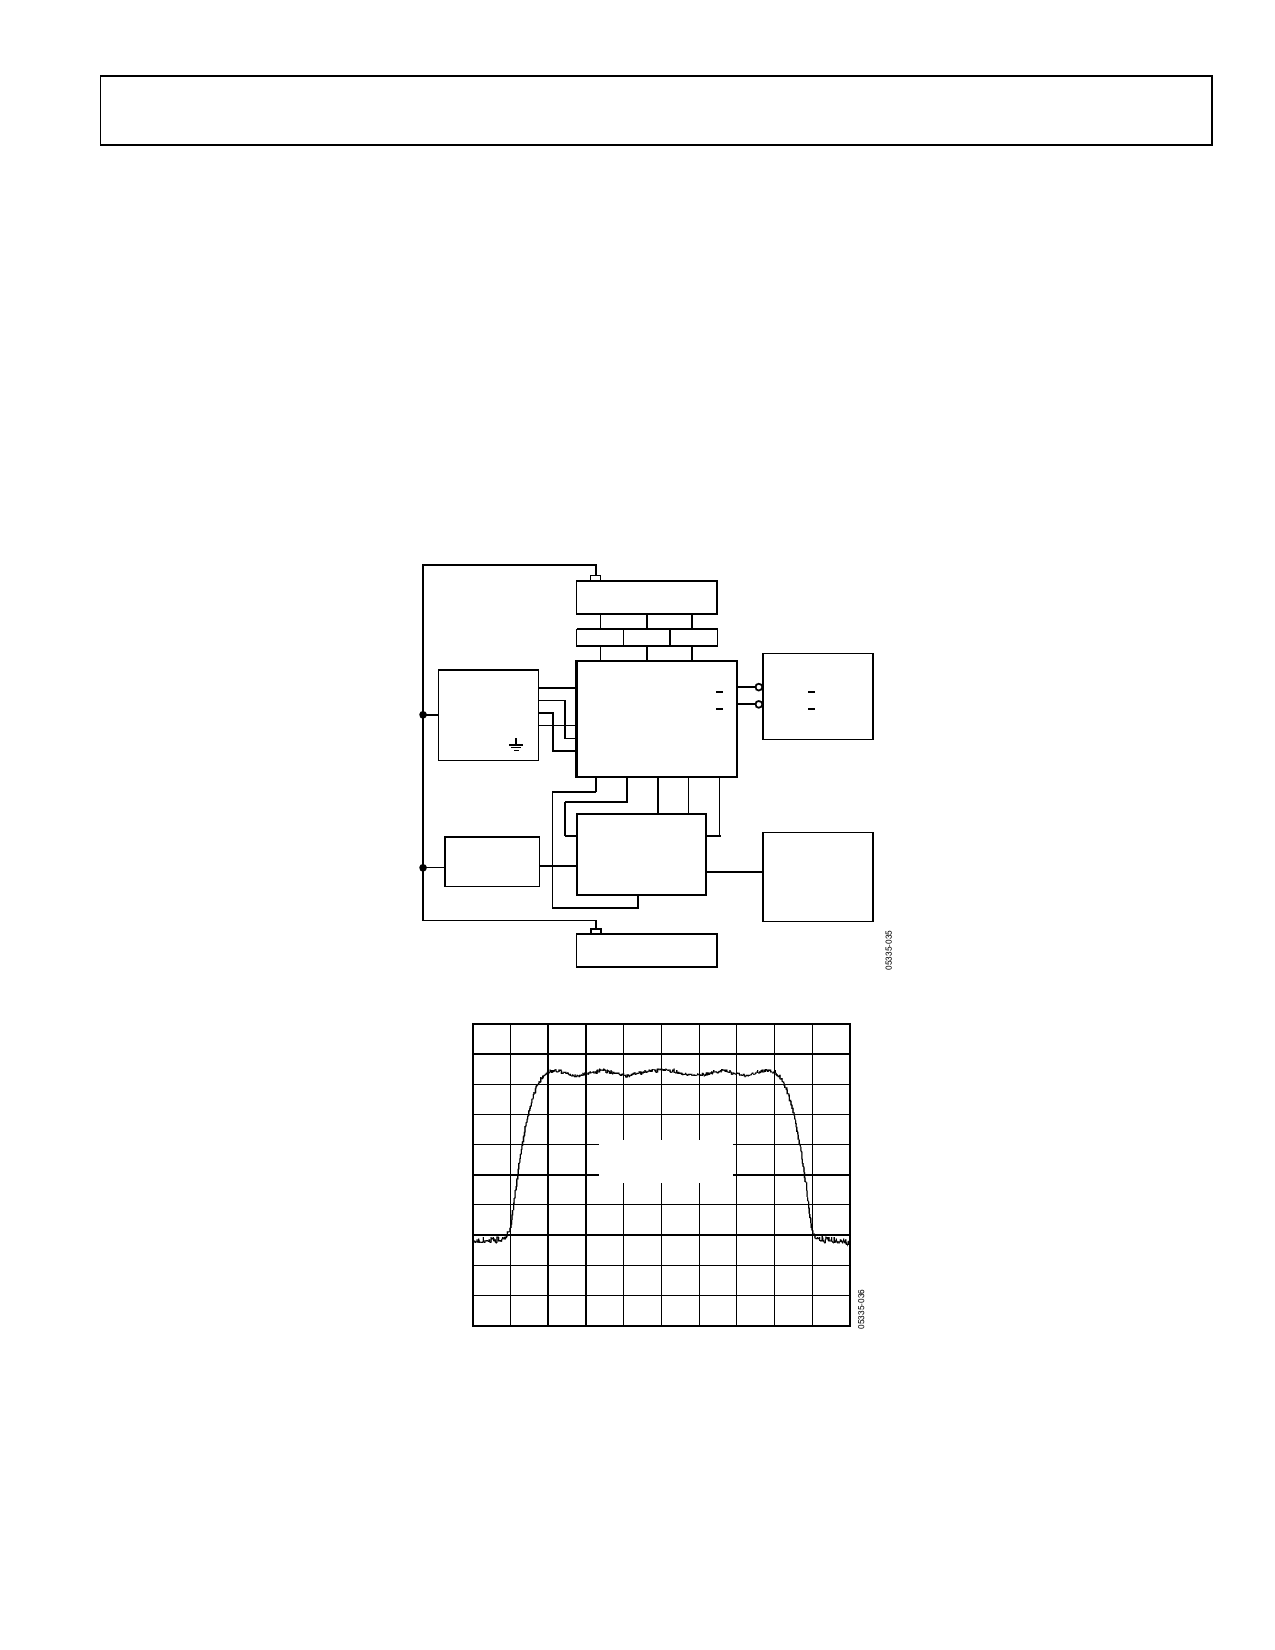
For measuring ACPR, the I/Q input signals used were generated
with Pilot (Walsh Code 00), Sync (WC 32), Paging (WC 01),
and 6 Traffic (WC 08, 09, 10, 11, 12, 13) channels active. The
I/Q SIM software was set for 32× oversampling and was using a
BS equifilter. Figure 36 shows the typical output spectrum for
this configuration. The ACPR was measured 885 kHz away
from the carrier frequency.
For performing EVM, Rho, phase, and amplitude balance
measurements, the I/Q input signals used were generated with
only the pilot channel (Walsh Code 00) active. The I/Q SIM
software was set for 32× oversampling using a CDMA equifilter.
IEEE
+15V MAX
COM
+25V MAX
–25V MAX
HP3631
IEEE HP34970A
D1
D2
D3
34901 34907 34907
D1
D2
D3
VPS1
I IN
AD8346 Q IN
VN MOTHERBOARD
GND
VP
P1 IN IP QP QN
TEKAFG2020
OUTPUT 1
OUTPUT 2
IEEE
ARB FUNC. GEN
HP8648C
IEEE
RFOUT
IP QP
IN AD8346 QN
EVAL BOARD
LO
ENBL P1
VOUT
FSEA30
RF I/P
IEEE
SPECTRUM
ANALYZER
IEEE
PC CONTROLLER
Figure 35. Evaluation Board CDMA Test Setup
–20
–30
–40
–50
–60
CH PWR = –20.7dBm
ACP UPR = –71.8dBc
–70
ACP LWR = –71.7dBc
–80
–90
–100
–110
–120
CENTER 1.9GHz
187.5kHz/
SPAN 1.875MHz
Figure 36. Typical CDMA Output Spectrum
Rev. A | Page 17 of 20
Share Link: 