ADXL326 データシートの表示(PDF) - Analog Devices
部品番号
コンポーネント説明
一致するリスト
ADXL326 Datasheet PDF : 16 Pages
| |||
ADXL326
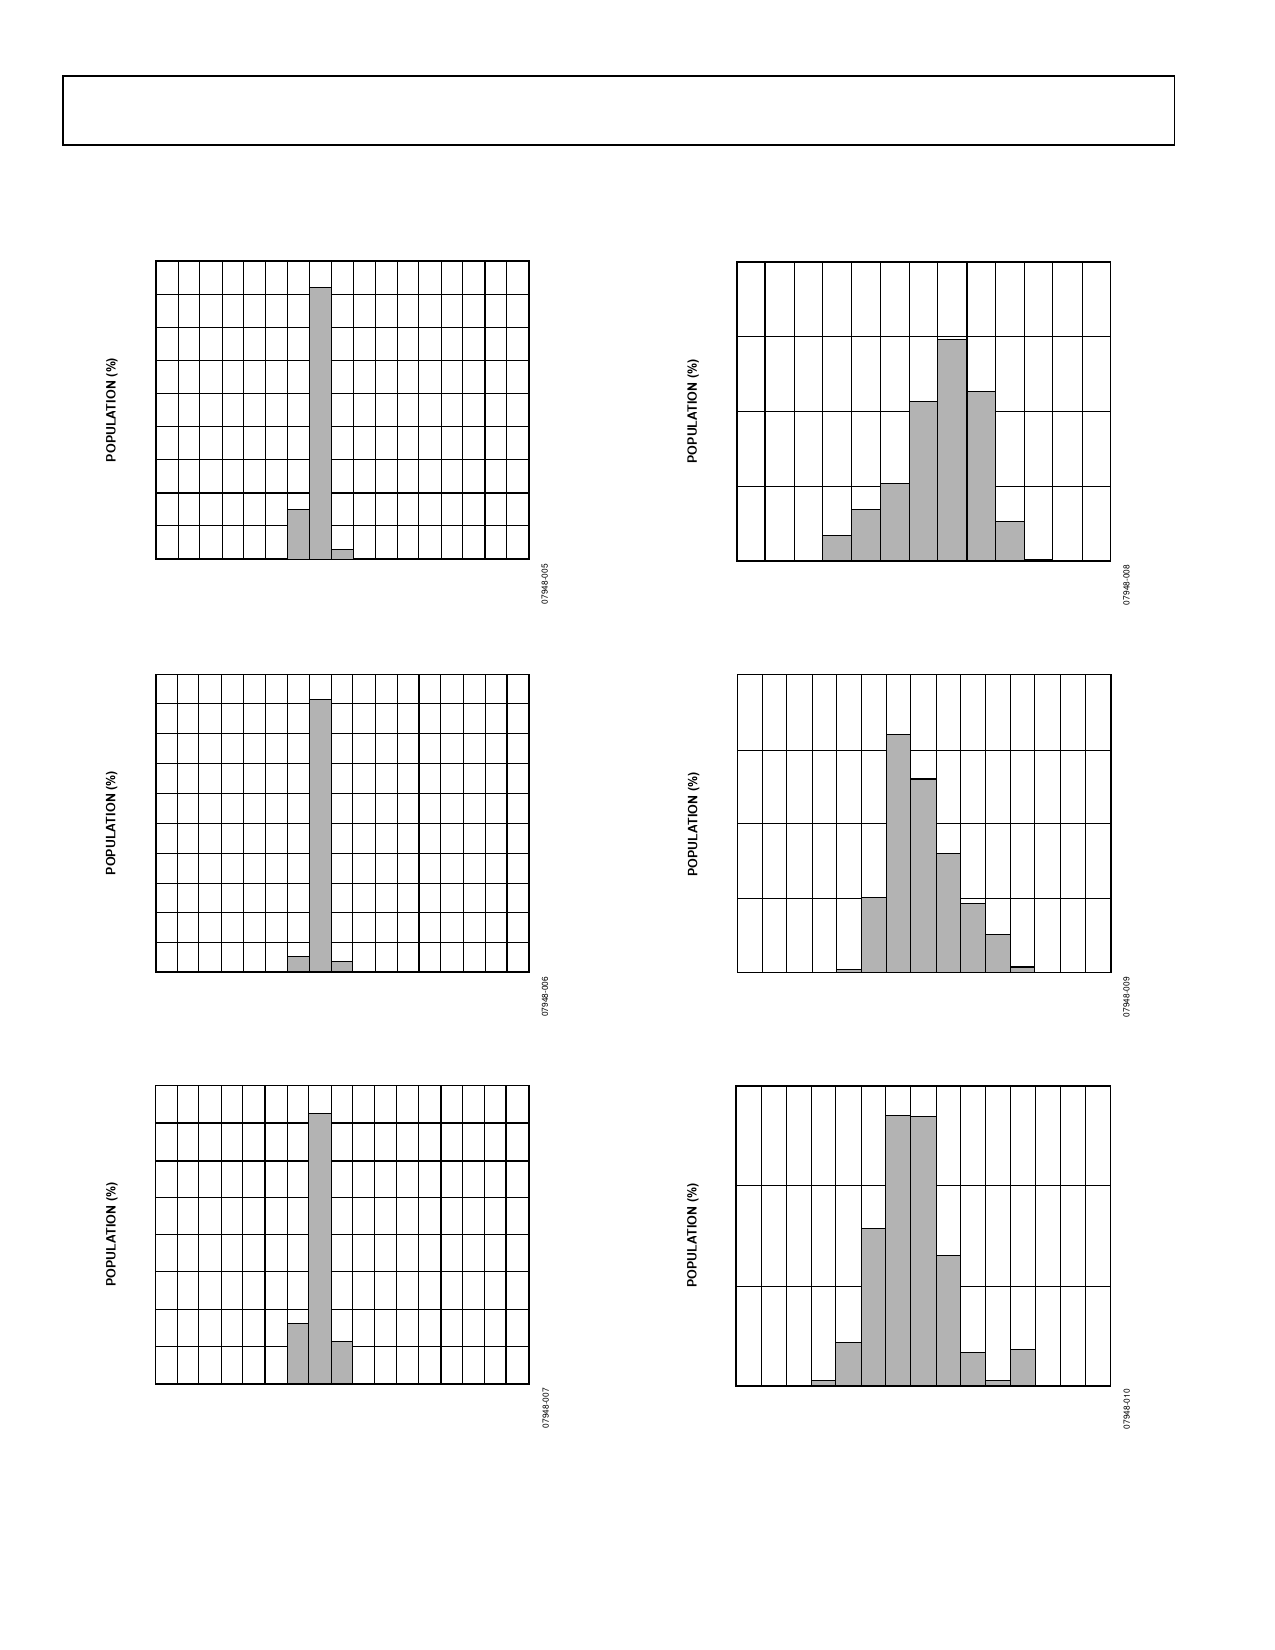
TYPICAL PERFORMANCE CHARACTERISTICS
N > 1000 for all typical performance plots, unless otherwise noted.
90
80
70
60
50
40
30
20
10
0
1.46 1.47 1.48 1.49 1.50 1.51 1.52 1.53 1.54
OUTPUT (V)
Figure 3. X-Axis Zero g Bias at 25°C, VS = 3 V
100
90
80
70
60
50
40
30
20
10
0
1.46 1.47 1.48 1.49 1.50 1.51 1.52 1.53 1.54
OUTPUT (V)
Figure 4. Y-Axis Zero g Bias at 25°C, VS = 3 V
80
70
60
50
40
30
20
10
0
1.46 1.47 1.48 1.49 1.50 1.51 1.52 1.53 1.54
OUTPUT (V)
Figure 5. Z-Axis Zero g Bias at 25°C, VS = 3 V
40
30
20
10
0
–62
–60
–58
–56
–54
–52
–50
VOLTAGE (mV)
Figure 6. X-Axis Self Test Response at 25°C, VS = 3 V
40
30
20
10
0
52
54
56
58
60
62
64
66
VOLTAGE (mV)
Figure 7. Y-Axis Self Test Response at 25°C, VS = 3 V
30
20
10
0
90
92
94
96
98
100 102 104
VOLTAGE (mV)
Figure 8. Z-Axis Self Test Response at 25°C, VS = 3 V
Rev. 0 | Page 6 of 16
Share Link: 