R4332(2006) データシートの表示(PDF) - Hamamatsu Photonics
部品番号
コンポーネント説明
一致するリスト
R4332 Datasheet PDF : 4 Pages
| |||
PHOTOMULTIPLIER TUBES R3788, R4332
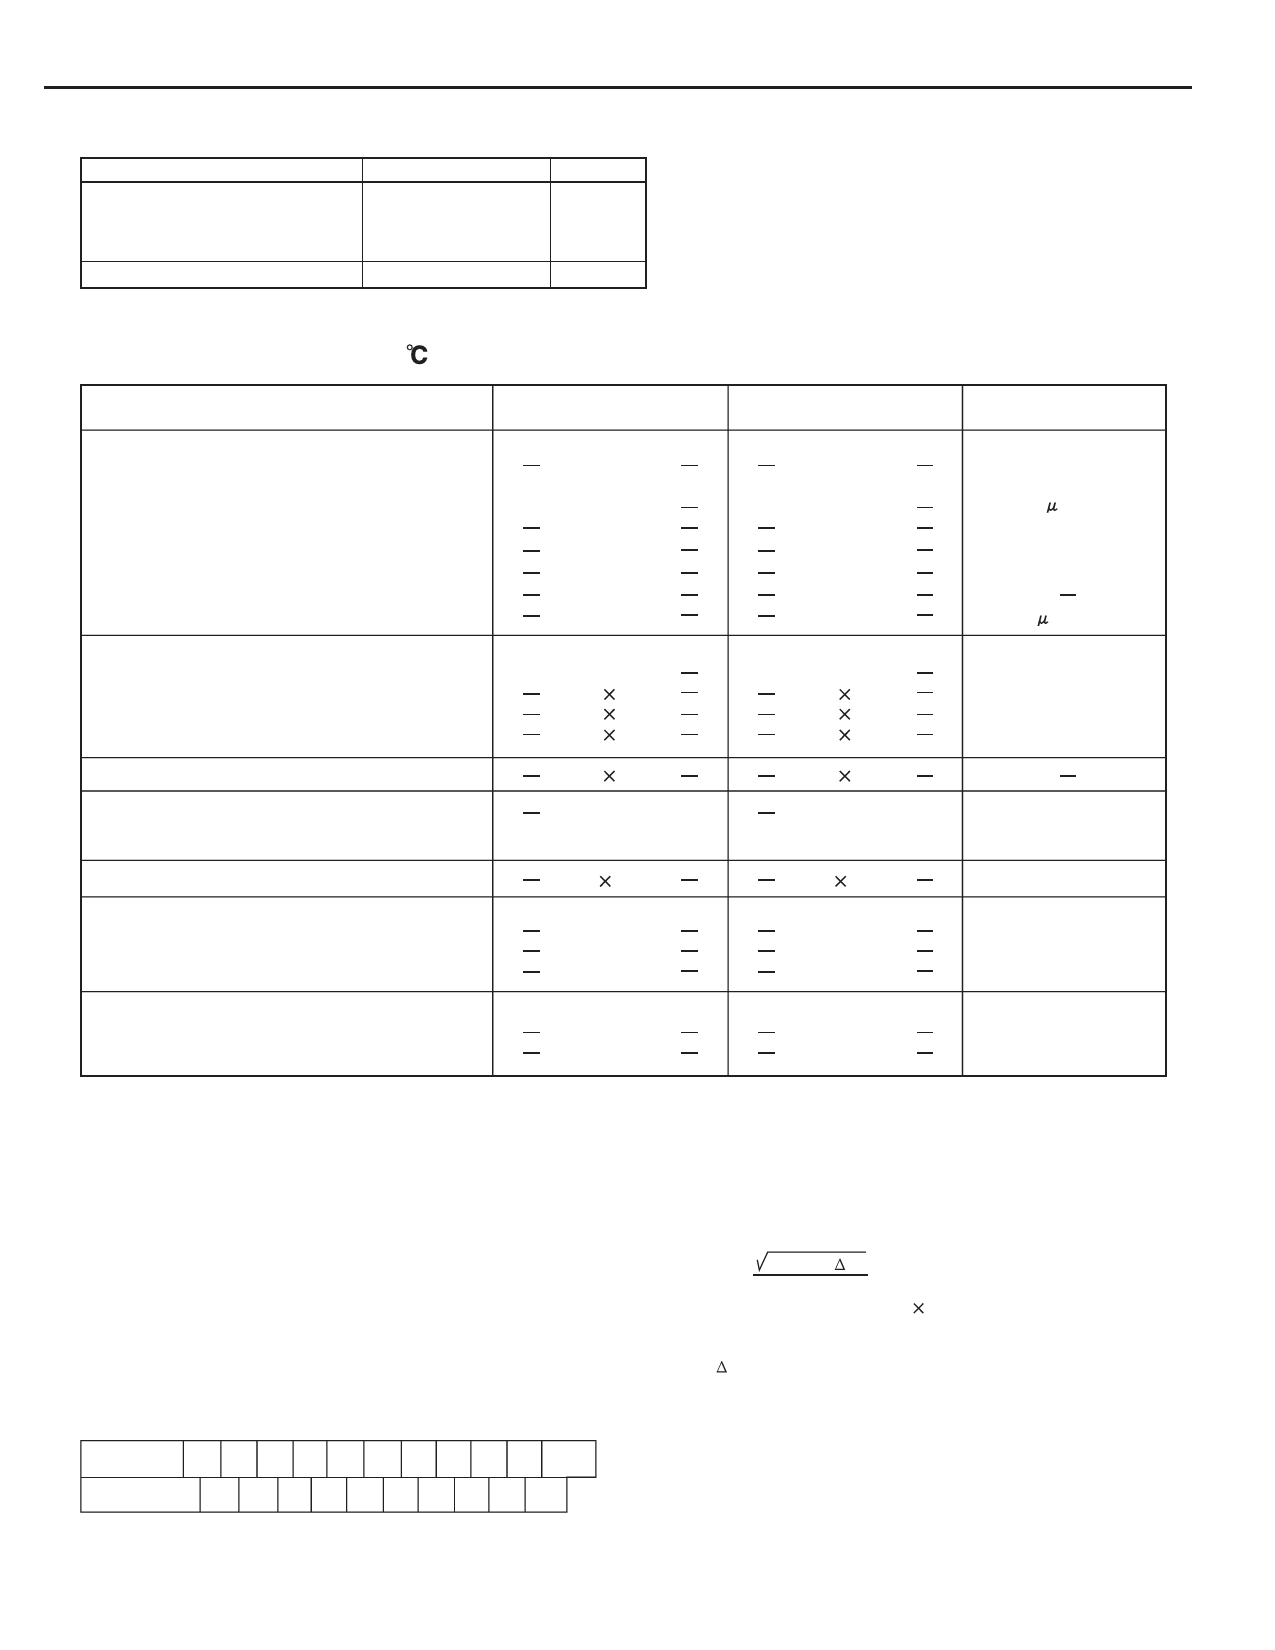
MAXIMUM RATINGS (Absolute Maximum Values)
Parameter
Value
Unit
Supply Voltage
Between Anode and Cathode
Between Anode and Last Dynode
1250
250
V
V
Average Anode Current A
0.1
mA
CHARACTERISTlCS (at 25 °C)
Parameter
Quantum Efficiency
(at Peak Wavelength)
Luminous B
Cathode Sensitivity Radiant
at 194 nm
at 210 nm
at 420 nm
Red/White Ratio C
Blue Sensitivity Index D
Luminous E
Anode Sensitivity
Radiant
at 194 nm
at 210 nm
at 420 nm
Gain E
Anode Dark Current F (After 30 min Storage in Darkness)
ENI (Equivalent Noise Input) G
Anode Pulse Rise Time H
Time Response E
Electron Transit Time I
Transit Time Spread (TTS) J
Anode Current Stability K
Light Hysteresis
Voltage Hysteresis
Min.
—
100
—
—
—
—
—
500
—
—
—
—
—
—
—
—
—
—
—
R3788
Typ.
30
(at 250 nm)
120
31
50
90
0.01
10
1200
3.1 × 10⁵
5.0 × 10⁵
9.0 × 10⁵
1.0 × 10⁷
5
1.4 × 10⁻¹⁶
2.2
22
1.2
0.1
1.0
Max.
—
—
—
—
—
—
—
—
—
—
—
—
50
—
—
—
—
—
—
Min.
—
100
—
—
—
—
—
500
—
—
—
—
—
—
—
—
—
—
—
R4332
Typ.
40
(at 210 nm)
120
60
68
90
0.01
10
1200
6.0 × 10⁵
6.8 × 10⁵
9.0 × 10⁵
1.0 × 10⁷
5
1.4 × 10⁻¹⁶
2.2
22
1.2
0.1
1.0
Max.
—
—
—
—
—
—
—
—
—
—
—
—
50
—
—
—
—
—
—
Unit
%
µA/lm
mA/W
mA/W
mA/W
—
—
A/lm
A/W
A/W
A/W
—
nA
W
ns
ns
ns
%
%
NOTES
A: Averaged over any interval of 30 seconds maximum.
B: The light source is a tungsten filament lamp operated at a distribution
temperature of 2856K. Supply voltage is 100 V between the cathode and
all other electrodes connected together as anode.
C:Red/White ratio is the quotient of the cathode current measured using a
red filter (Toshiba R-68) interposed between the light source and the tube
by the cathode current measured with the filter removed under the same
conditions as Note B.
D:The value is cathode output current when a blue filter (Corning CS 5-58
polished to 1/2 stock thickness) is interposed between the light source and
the tube under the same condition as Note B.
E: Measured with the same light source as Note B and with the voltage
distribution ratio shown in Table 1 below.
Table 1: Voltage Distribution Ratio
Electrodes K Dy1 Dy2 Dy3 Dy4 Dy5 Dy6 Dy7 Dy8 Dy9 P
Distribution
Ratio
1 1111 11111
SuppIy Voltage: 1000 V, K: Cathode, Dy: Dynode, P: Anode
F: Measured with the same supply voltage and voltage distribution ratio as
Note E after removal of light.
G:ENI is an indication of the photon-limited signal-to-noise ratio. It refers to
the amount of light in watts to produce a signal-to-noise ratio of unity in the
output of a photomultiplier tube.
ENI = 2q.ldb.G.∆f
S
where q = Electronic charge (1.60 × 10⁻¹⁹ coulomb).
ldb = Anode dark current(after 30 minutes storage) in amperes.
G = Gain.
∆f = Bandwidth of the system in hertz. 1 hertz is used.
S = Anode radiant sensitivity in amperes per watt at the
wavelength of peak response.
H:The rise time is the time for the output pulse to rise from 10 % to 90 % of
the peak amplitude when the entire photocathode is illuminated by a delta
function light pulse.
I: The electron transit time is the interval between the arrival of delta function
light pulse at the entrance window of the tube and the time when the anode
output reaches the peak amplitude. In measurement, the whole
photocathode is illuminated.
J: Also called transit time jitter. This is the fluctuation in electron transit time
between individual pulses in the signal photoelectron mode, and may be
defined as the FWHM of the frequency distribution of electron transit times.
K: Hysteresis is temporary instability in anode current after light and voltage
are applied.
Hysteresis =
lmax. lmin. × 100 (%)
li
li
l max.
l min.
TIME
0
5
6
7 (minutes)
TPMSB0002EA
(1)Light Hysteresis
The tube is operated at 750 V with an anode current of 1 µA for 5 minutes.
The light is then removed from the tube for a minute. The tube is then
re-illuminated by the previous light level for a minute to measure the variation.
(2)Voltage Hysteresis
The tube is operated at 300 V with an anode current of 0.1 µA for 5 minutes.
The light is then removed from the tube and the supply voltage is quickly
increased to 800 V. After a minute, the supply voltage is then reduced to the
previous value and the tube is re-illuminated for a minute to measure the
variation.
Share Link: 